Scales in d3.js
Any time that you want to visualize data in d3.js that is either a range of continuous values or discrete categories, you want to set up a scale to map the value.
Using scales
Motivation: Exam grades
Suppose we want to create a visualization that maps the grades for an exam as
points along a horizontal line. Possible scores on the exam are [0, 100].
Using the boilerplate code, our visualization
(and, thereby, the horizontal line we are drawing our points on) is width pixels
wide. If we space the scores out linearly, we would need to calculate the
location of every point:
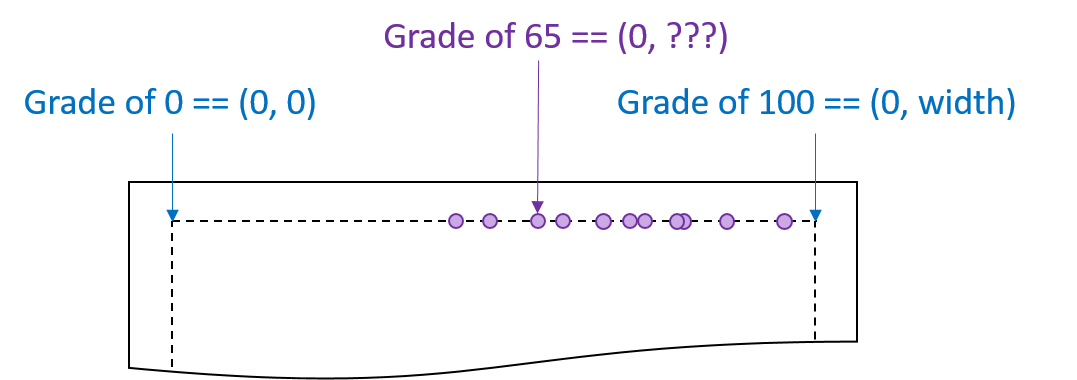
It is possible to use math to find out the exact location for the grade of 65, but d3.js provides this for us.
All d3.js scales maps input values (the domain) to output values (the range) via a function. As a visualization designer, you need to determine what input domain and output range is needed for the data.
In the example above,
- the input domain is the scores, which was [0, 100]
- the range is along the horizontal width of the image, which was [0, width]
Using a linear scale, the code to create the scale is as follows:
var gradeScale = d3.scale.linear()
                         .domain([0, 100])
                         .range([0, width]);
The variable returned, a d3.js scale variable, can be used to draw an axis for that scale or to apply the scale to a number. To apply the scale, use the variable as a function:
var userGrade = gradeScale(65);   // maps 65 into the range
                                  // ...if the width was 300, 65 -> 195
                                  // ...if the width was 500, 65 -> 325
Types of scales
Quantitative scales
Quantitative scales are useful when your input domain is in the form of continuous values. d3.js provides several different forms of quantitative scales, including:
d3.scale.linear(), creating a linear scale [d3.js documentation wiki]d3.scale.pow().exponent(x), creating a power-scale, given a powerx[d3.js documentation wiki]d3.scale.sqrt()is a power-scale with the power0.5
d3.scale.log().base(x), creating a log-scale, given a basex[d3.js documentation wiki]d3.scale.log()creates a base-10 log-scale
Additionally, d3.js provides several other quantitative scales that are useful in more specific cases:
d3.scale.threshold(), creating a threshold scale (eg:90->A) [d3.js documentation wiki]d3.scale.quantile()[d3.js documentation wiki]d3.scale.quantize()[d3.js documentation wiki]
Ordinal scales
Quantitative scales are useful when your input domain is in the form of discrete categories. The output range can be defined to either be points (for scatter-plot-like visualizations) or bands (for bar-chart-like visualizations where a value maps to a wide area).
d3.scale.ordinal(), creating a ordinal scale [d3.js documentation wiki].range([values]), to specify points.rangeBands([values]), to specify bands