Boilerplate Code in d3.js
In Computer Science, boilerplate code is sections of code that have to be included in many places with little or no alteration [Wikipedia]. When using d3.js, the basic setup of the drawing area where you will draw the visualization is boilerplate code in d3.js. This section will help you understand its purpose and when modifications to the boilerplate code should be made.
Understanding d3.js boilerplate code
The coordinate system in d3.js
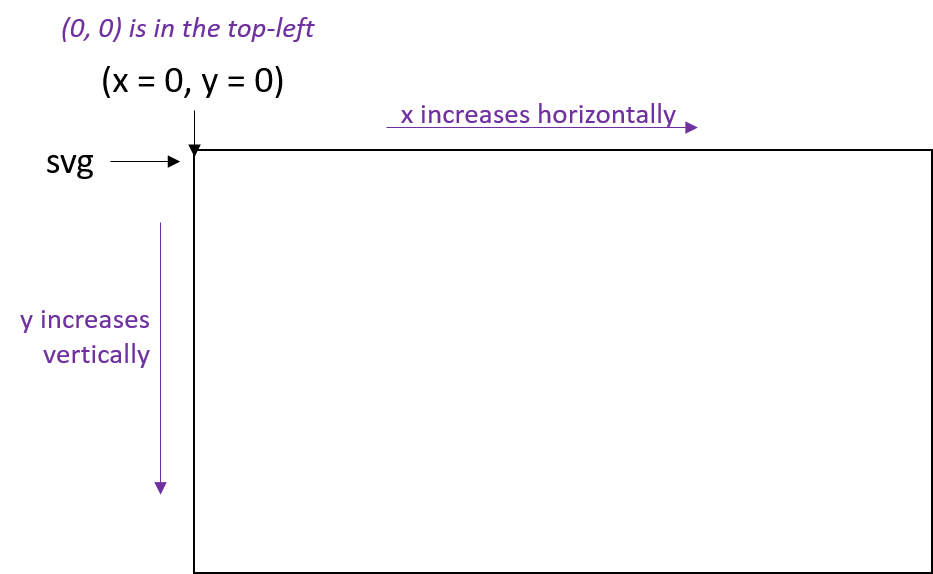
In nearly every application of computer graphics (as is the case in d3.js), the
top-left corner of is defined to be the origin or (x = 0, y = 0). From the origin
x increases horizontally and y increases vertically.
Note that the y-axis differs from the Cartesian coordinate system used in mathematics, where the y-axis in Computer Science increases move down from the origin at the top-left.
margin, width, and height variables
The first three lines of the boilerplate code for d3.js involves defining the size of the visualization:
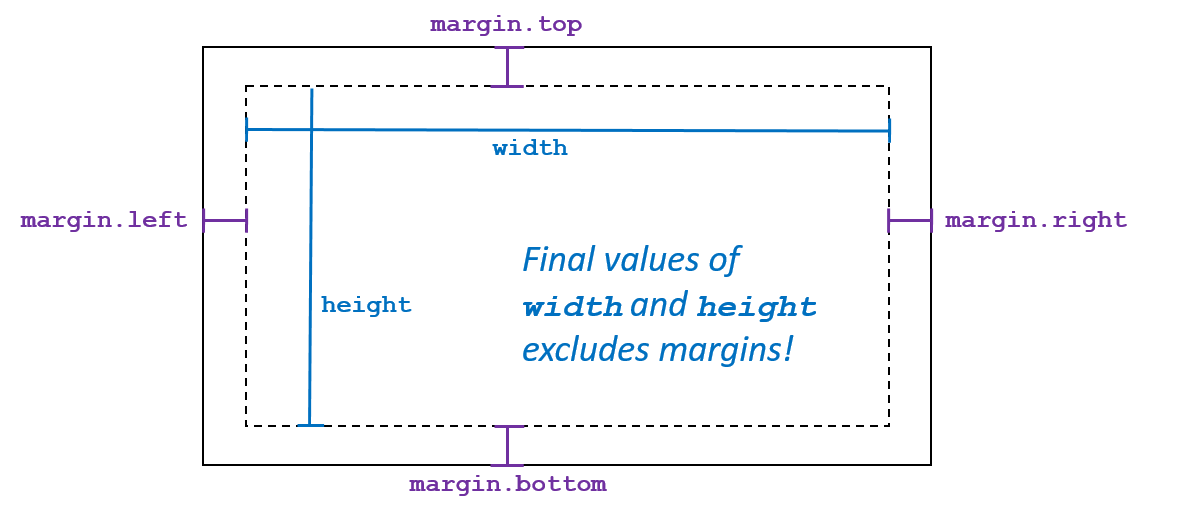
var margin = { top: 50, right: 50, bottom: 50, left: 50 },
    width = 970 - margin.left - margin.right,
    height = 700 - margin.top - margin.bottom;
The values of each of these variables are in values, in pixels, for the global
layout elements of the visualization.
- The margin values are contained in a JavaScript dictionary/object; you can
access their values with the code margin.left, margin.right, etc.
The default values given in the boilerplate code creates a drawing area that can be viewed, in full, on any desktop/laptop computer without scrolling either vertically or horizontally. These values may need to be adjusted for certain visualizations and would need to be adapted for mobile-friendly visualizations.
Visually, the following diagram illustrates the visualization with the margins, width, and height:
Creating the SVG canvas
The last eight lines of the boilerplate code creates the canvas that will be used to draw the visualization:
var svg = d3.select("#chart")
            .append("svg")
            .attr("width", width + margin.left + margin.right)
            .attr("height", height + margin.top + margin.bottom)
            .style("width", width + margin.left + margin.right)
            .style("height", height + margin.top + margin.bottom)
            .append("g")
            .attr("transform", "translate(" + margin.left + "," + margin.top + ")");
In this code, an svg variable is defined that will be used in the rest of the
visualization. SVG, which stands for Scalable Vector Graphics (SVG), is the
computer graphic language that d3.js generates to create your visualization.
The svg variable is first, by the very first line of code, attached to an
HTML tag. The code d3.select("#chart") finds the tag with id="chart"
and inserts the SVG canvas within that element. This requires that the HTML
document must contain a <div id="chart"></div> tag.
All eight lines of code is one long JavaScript statement, so each line of code
modifies the properties of the svg. The next five lines adds the SVG element
and sets the element’s width and height.
In the final two lines, the boilerplate code performs a transformation on the
canvas, changing the origin point by (margin.left, margin.top). By doing this,
the coordinate (0, 0) within the svg variable now references the top-left corner
of the drawing region (inside of the margins). This is illustrated in the following
diagram:
![]()
Full boilerplate code
var margin = { top: 50, right: 50, bottom: 50, left: 50 },
   width = 970 - margin.left - margin.right,
   height = 700 - margin.top - margin.bottom;

var svg = d3.select("#chart")
            .append("svg")
            .attr("width", width + margin.left + margin.right)
            .attr("height", height + margin.top + margin.bottom)
            .style("width", width + margin.left + margin.right)
            .style("height", height + margin.top + margin.bottom)
            .append("g")
            .attr("transform", "translate(" + margin.left + "," + margin.top + ")");